Respiriva combines established HRV science with advanced analysis methods. From time domain metrics to fractal analysis and AI-powered interpretation, every session is analyzed in depth.
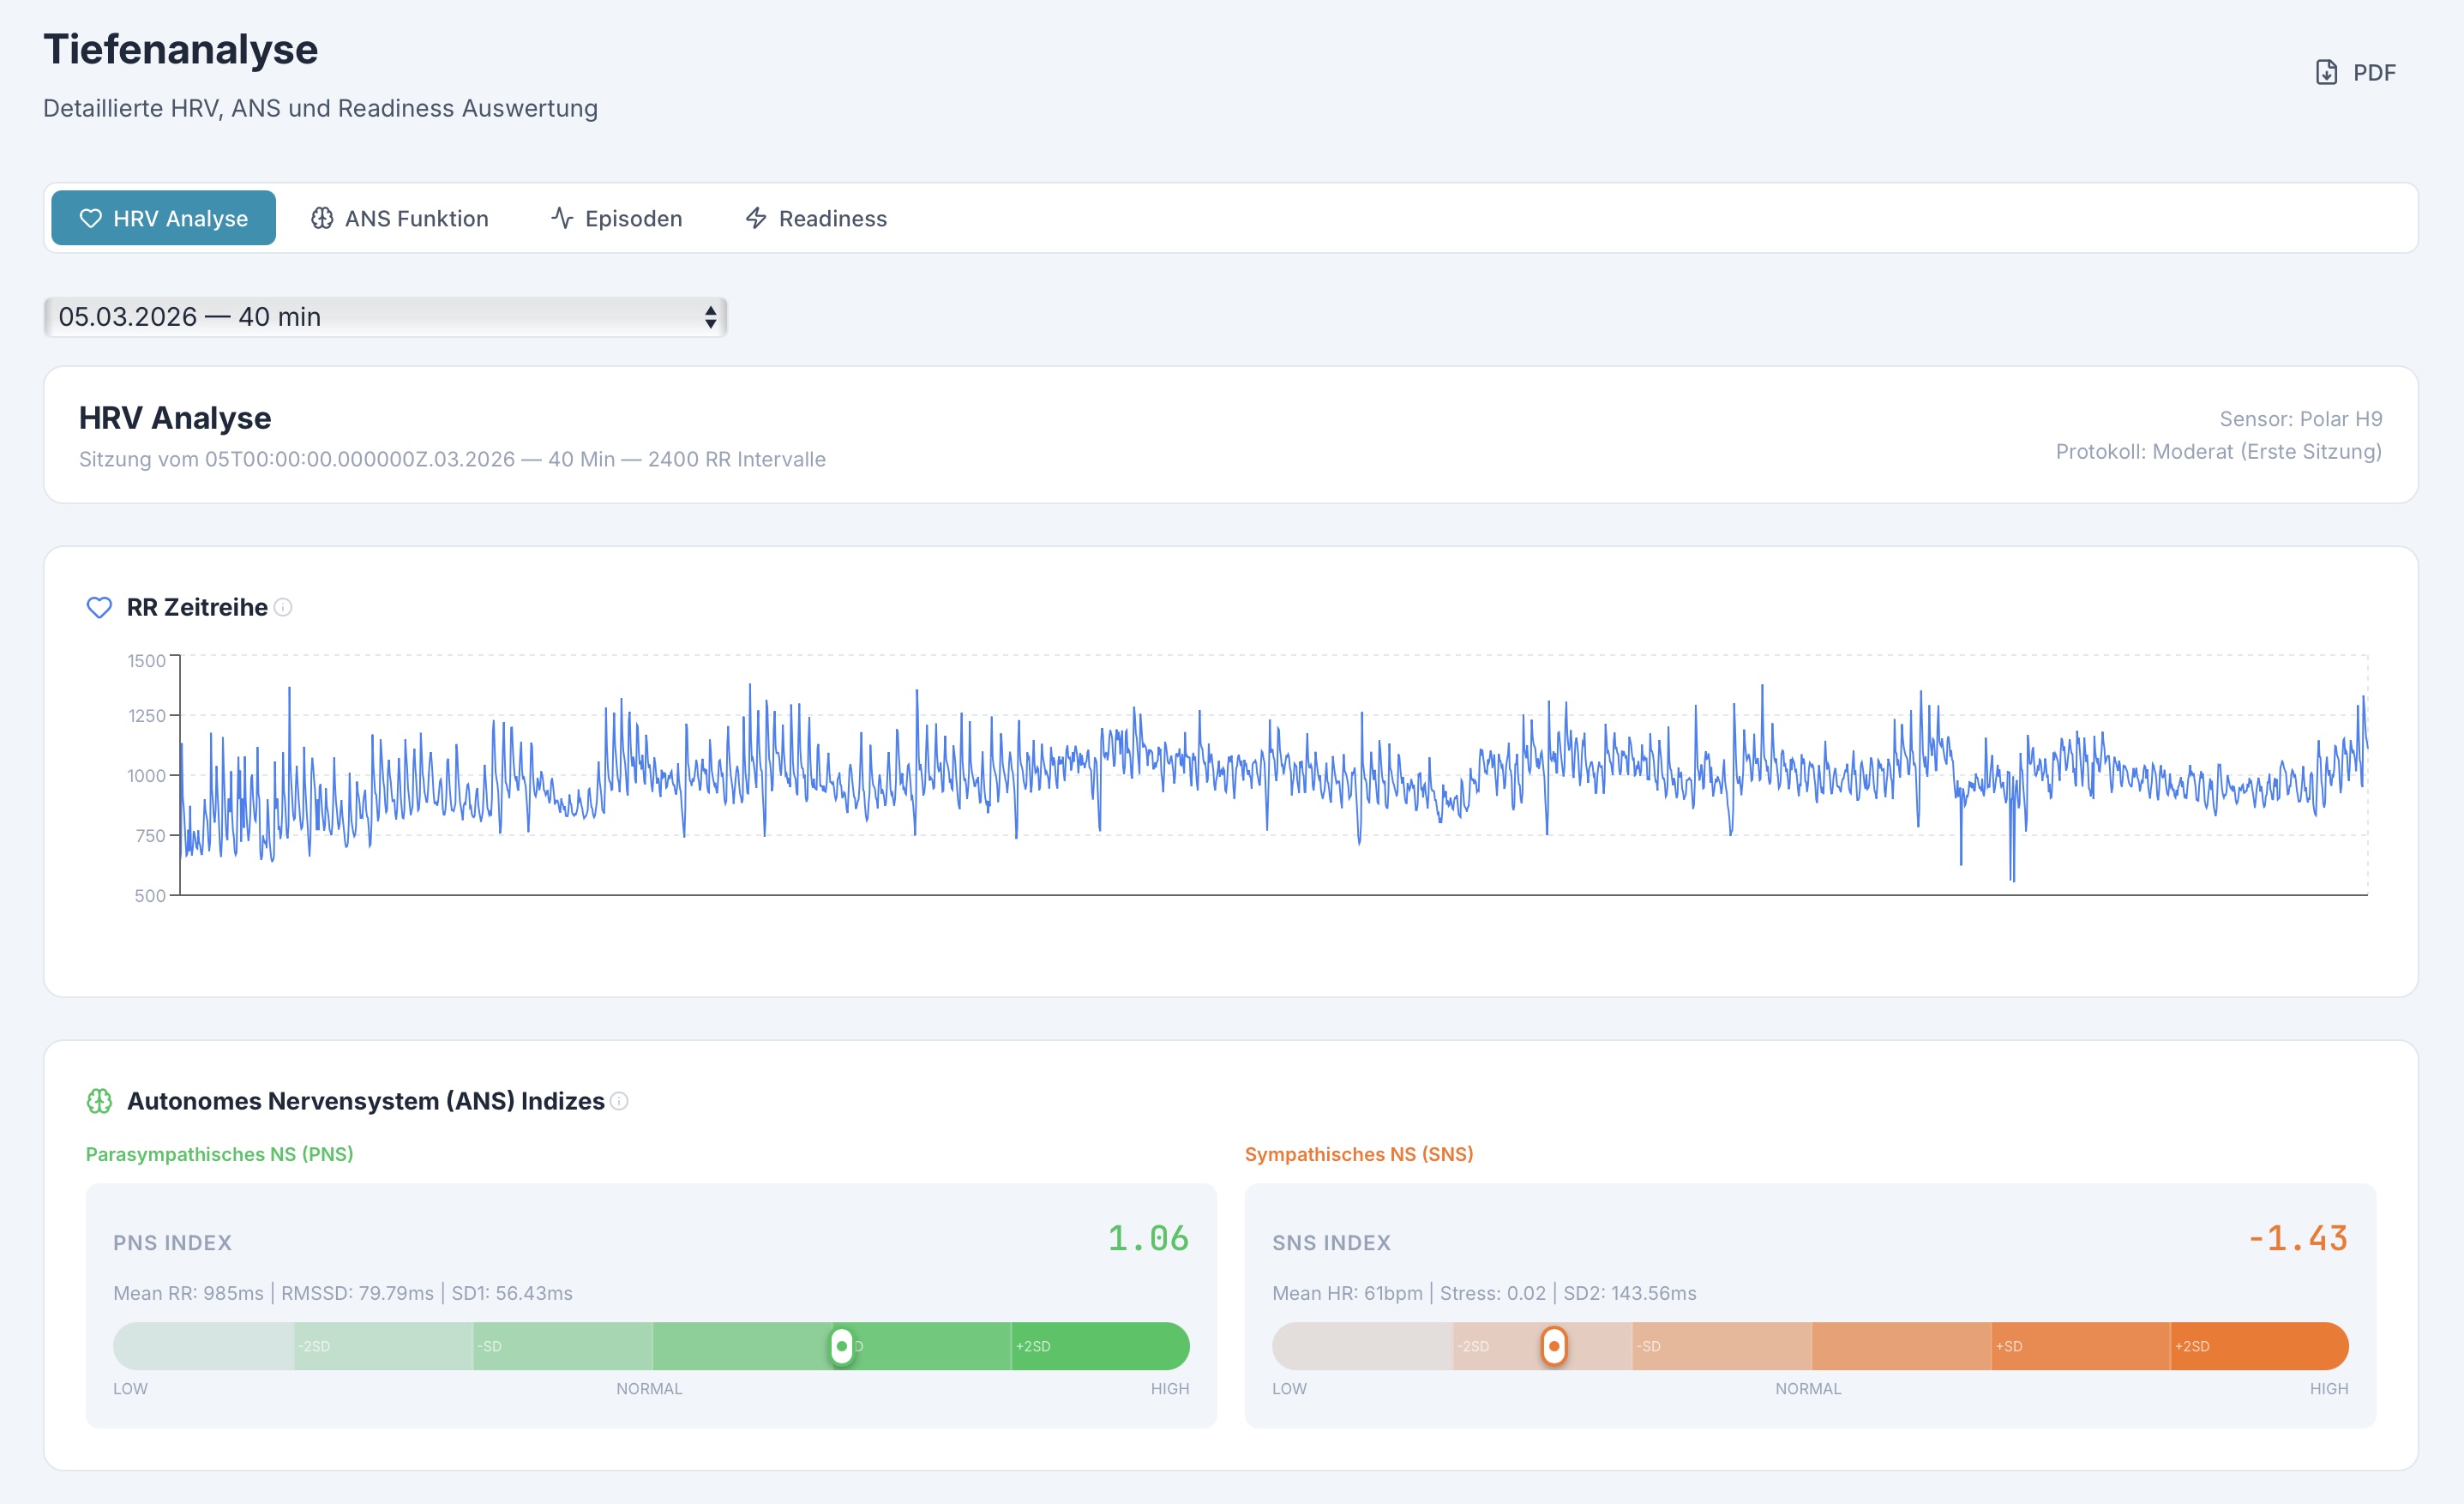
Every uploaded session is automatically analyzed for heart rate variability. Respiriva calculates all standard HRV metrics from the raw RR interval data, giving you a complete picture of autonomic nervous system activity during the IHHT session.
Root mean square of successive RR differences. Primary parasympathetic marker.
Standard deviation of RR intervals. Reflects overall autonomic variability.
Baevsky's Stress Index. Quantifies sympathetic activation and regulatory tension.
Average heart rate and RR interval. Baseline cardiovascular indicators.
Time domain analysis examines how RR intervals change over the course of the session. These metrics are the foundation of HRV analysis and provide direct insight into cardiac autonomic regulation.
Respiriva calculates these metrics both for the full session and for individual hypoxia/hyperoxia phases, allowing you to see how the autonomic nervous system responds to each training stimulus.
Power Spectral Density analysis decomposes heart rate variability into frequency components. Using the Welch method, Respiriva separates sympathetic and parasympathetic contributions to HRV, providing insights that time domain metrics alone cannot reveal.
Very Low Frequency. Linked to thermoregulation, hormonal, and renin-angiotensin systems.
Low Frequency. Mixed sympathetic and parasympathetic activity, baroreflex function.
High Frequency. Predominantly parasympathetic (vagal) activity, respiratory sinus arrhythmia.
Sympathovagal balance indicator. Higher values suggest greater sympathetic dominance.
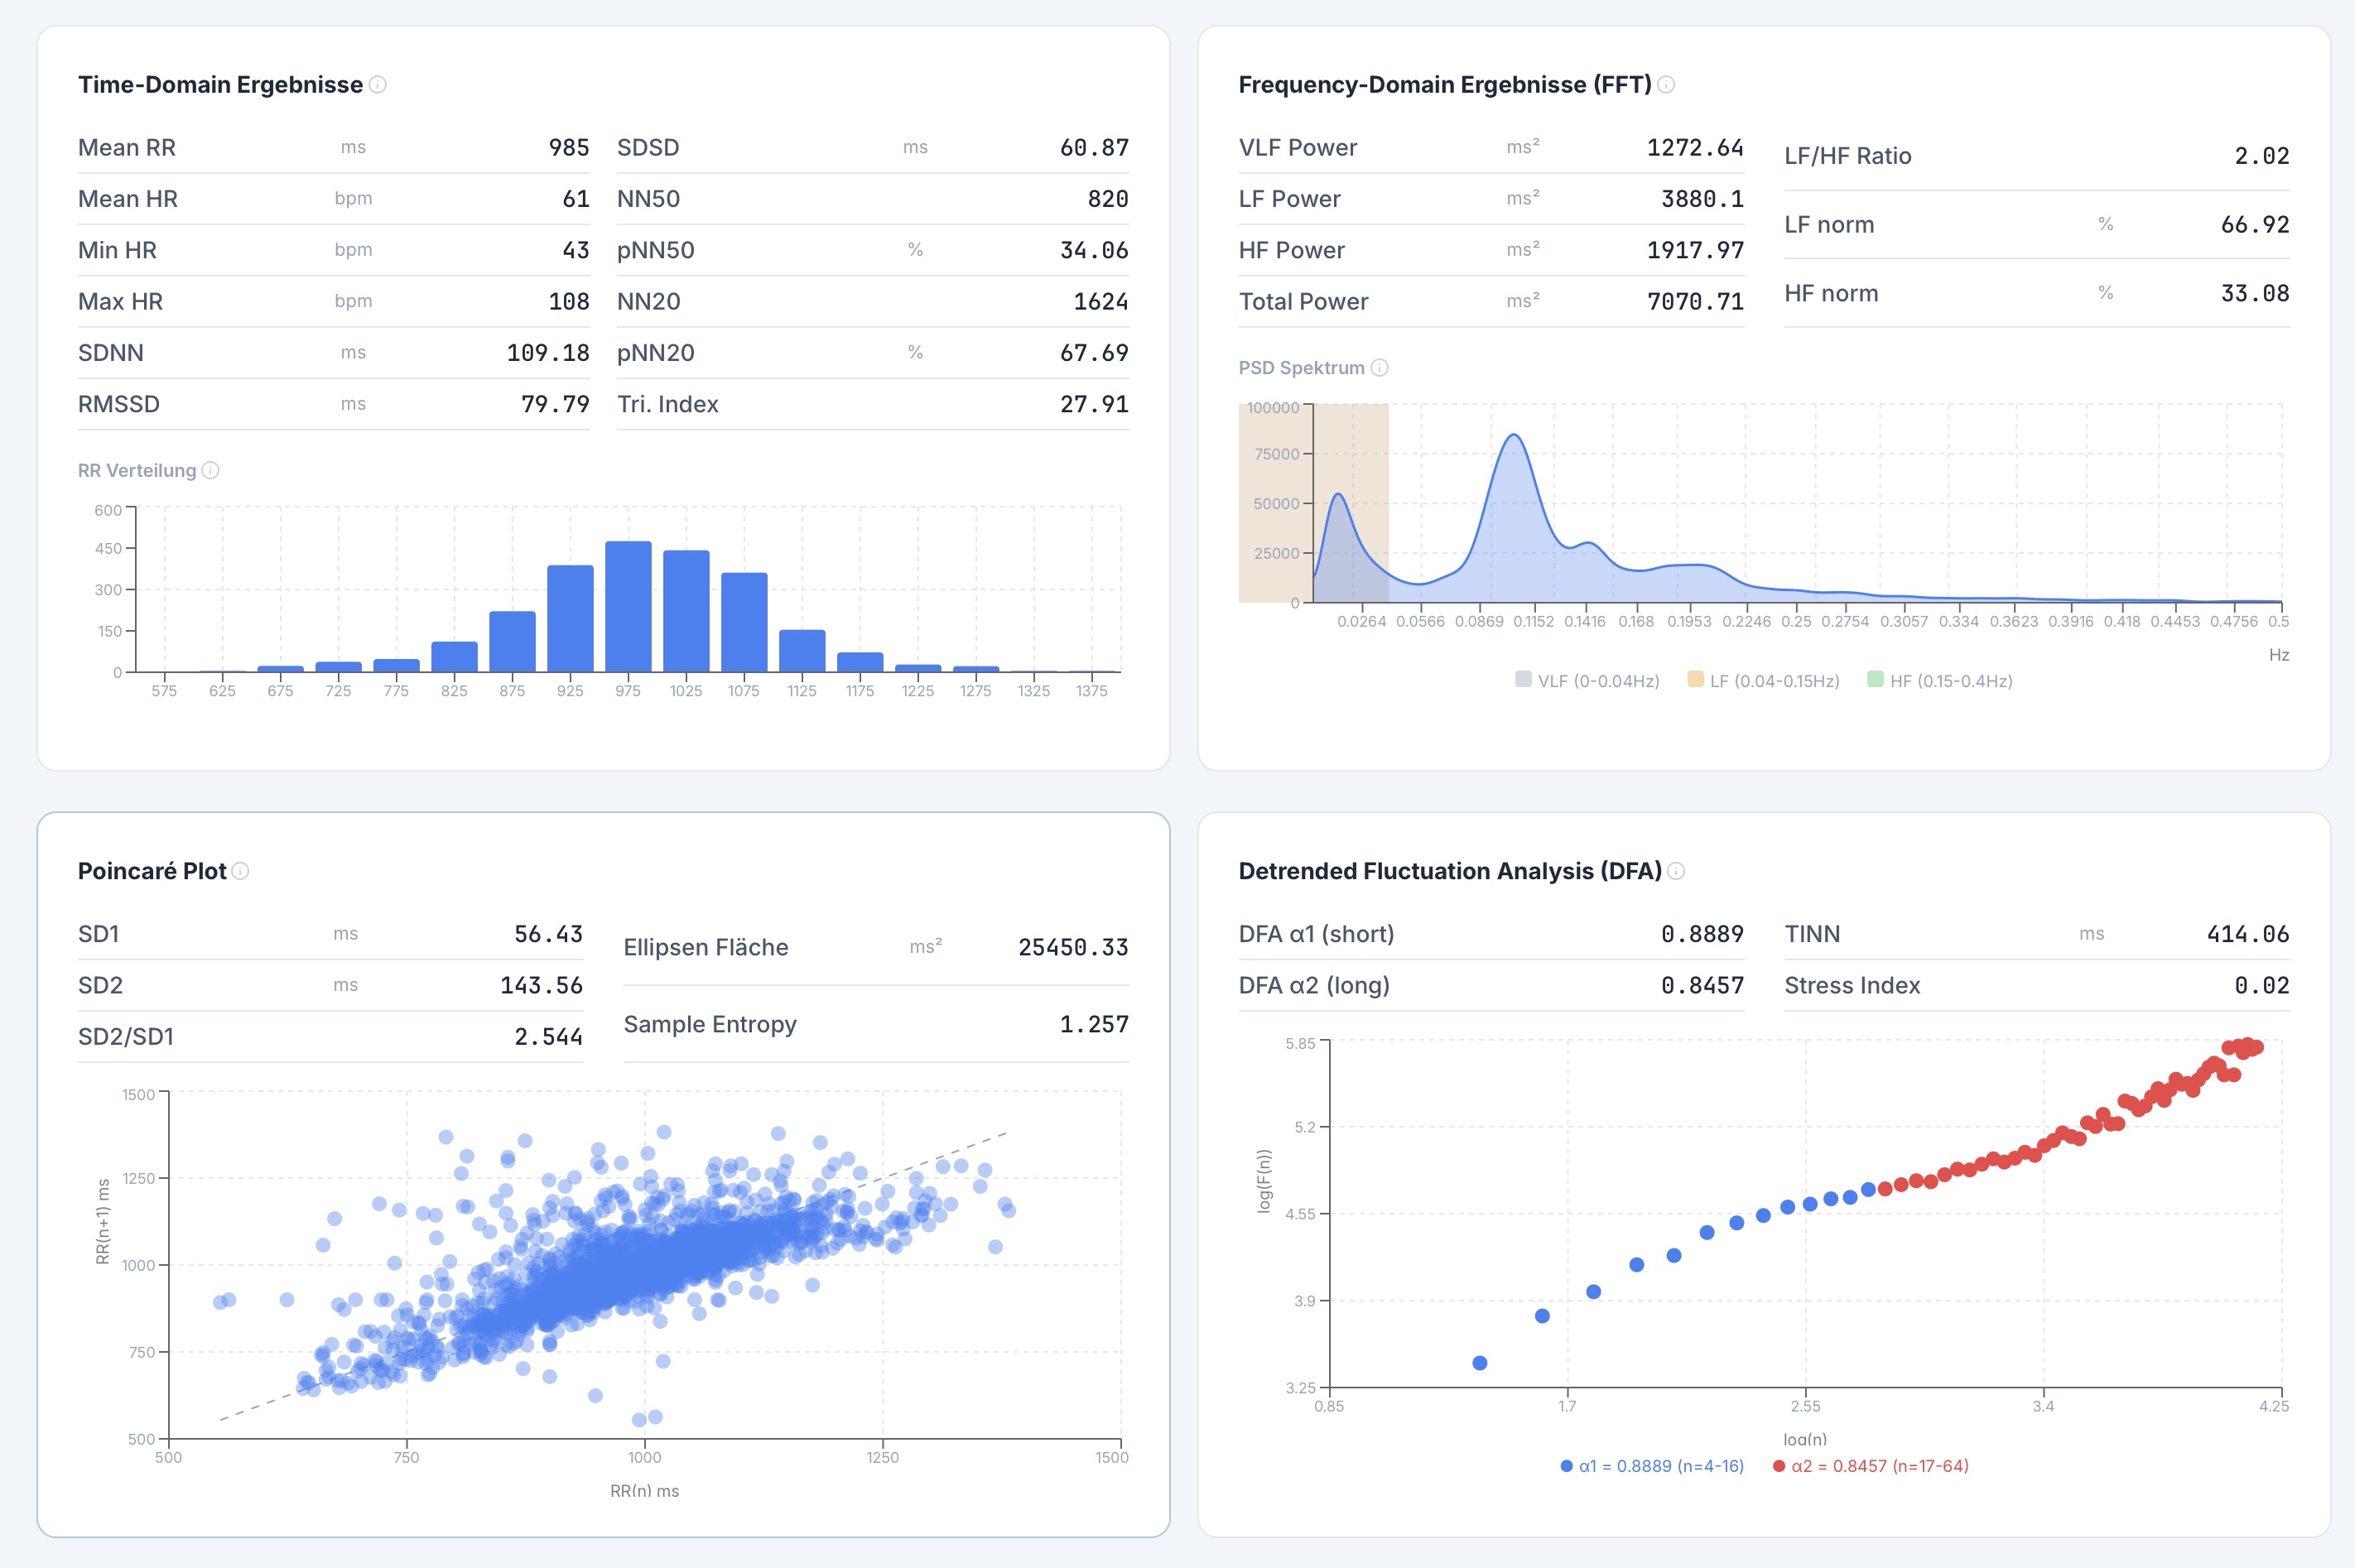
DFA reveals the fractal-like scaling properties of heart rate time series. Unlike simple statistical metrics, DFA captures the complexity and long-range correlations in cardiac rhythm that reflect the health of autonomic regulation.
Short-term fractal scaling. Values near 1.0 indicate healthy complexity. Lower values suggest uncorrelated dynamics.
Long-term fractal scaling. Reflects slower regulatory mechanisms and overall autonomic system health.
Poincare plots visualize the relationship between consecutive RR intervals by plotting each interval against the next. The resulting scatter pattern reveals beat-to-beat dynamics that are invisible in aggregate statistics.
Short-term variability (perpendicular to identity line). Reflects instantaneous beat-to-beat changes, primarily parasympathetic.
Long-term variability (along identity line). Captures overall HRV including both sympathetic and parasympathetic contributions.
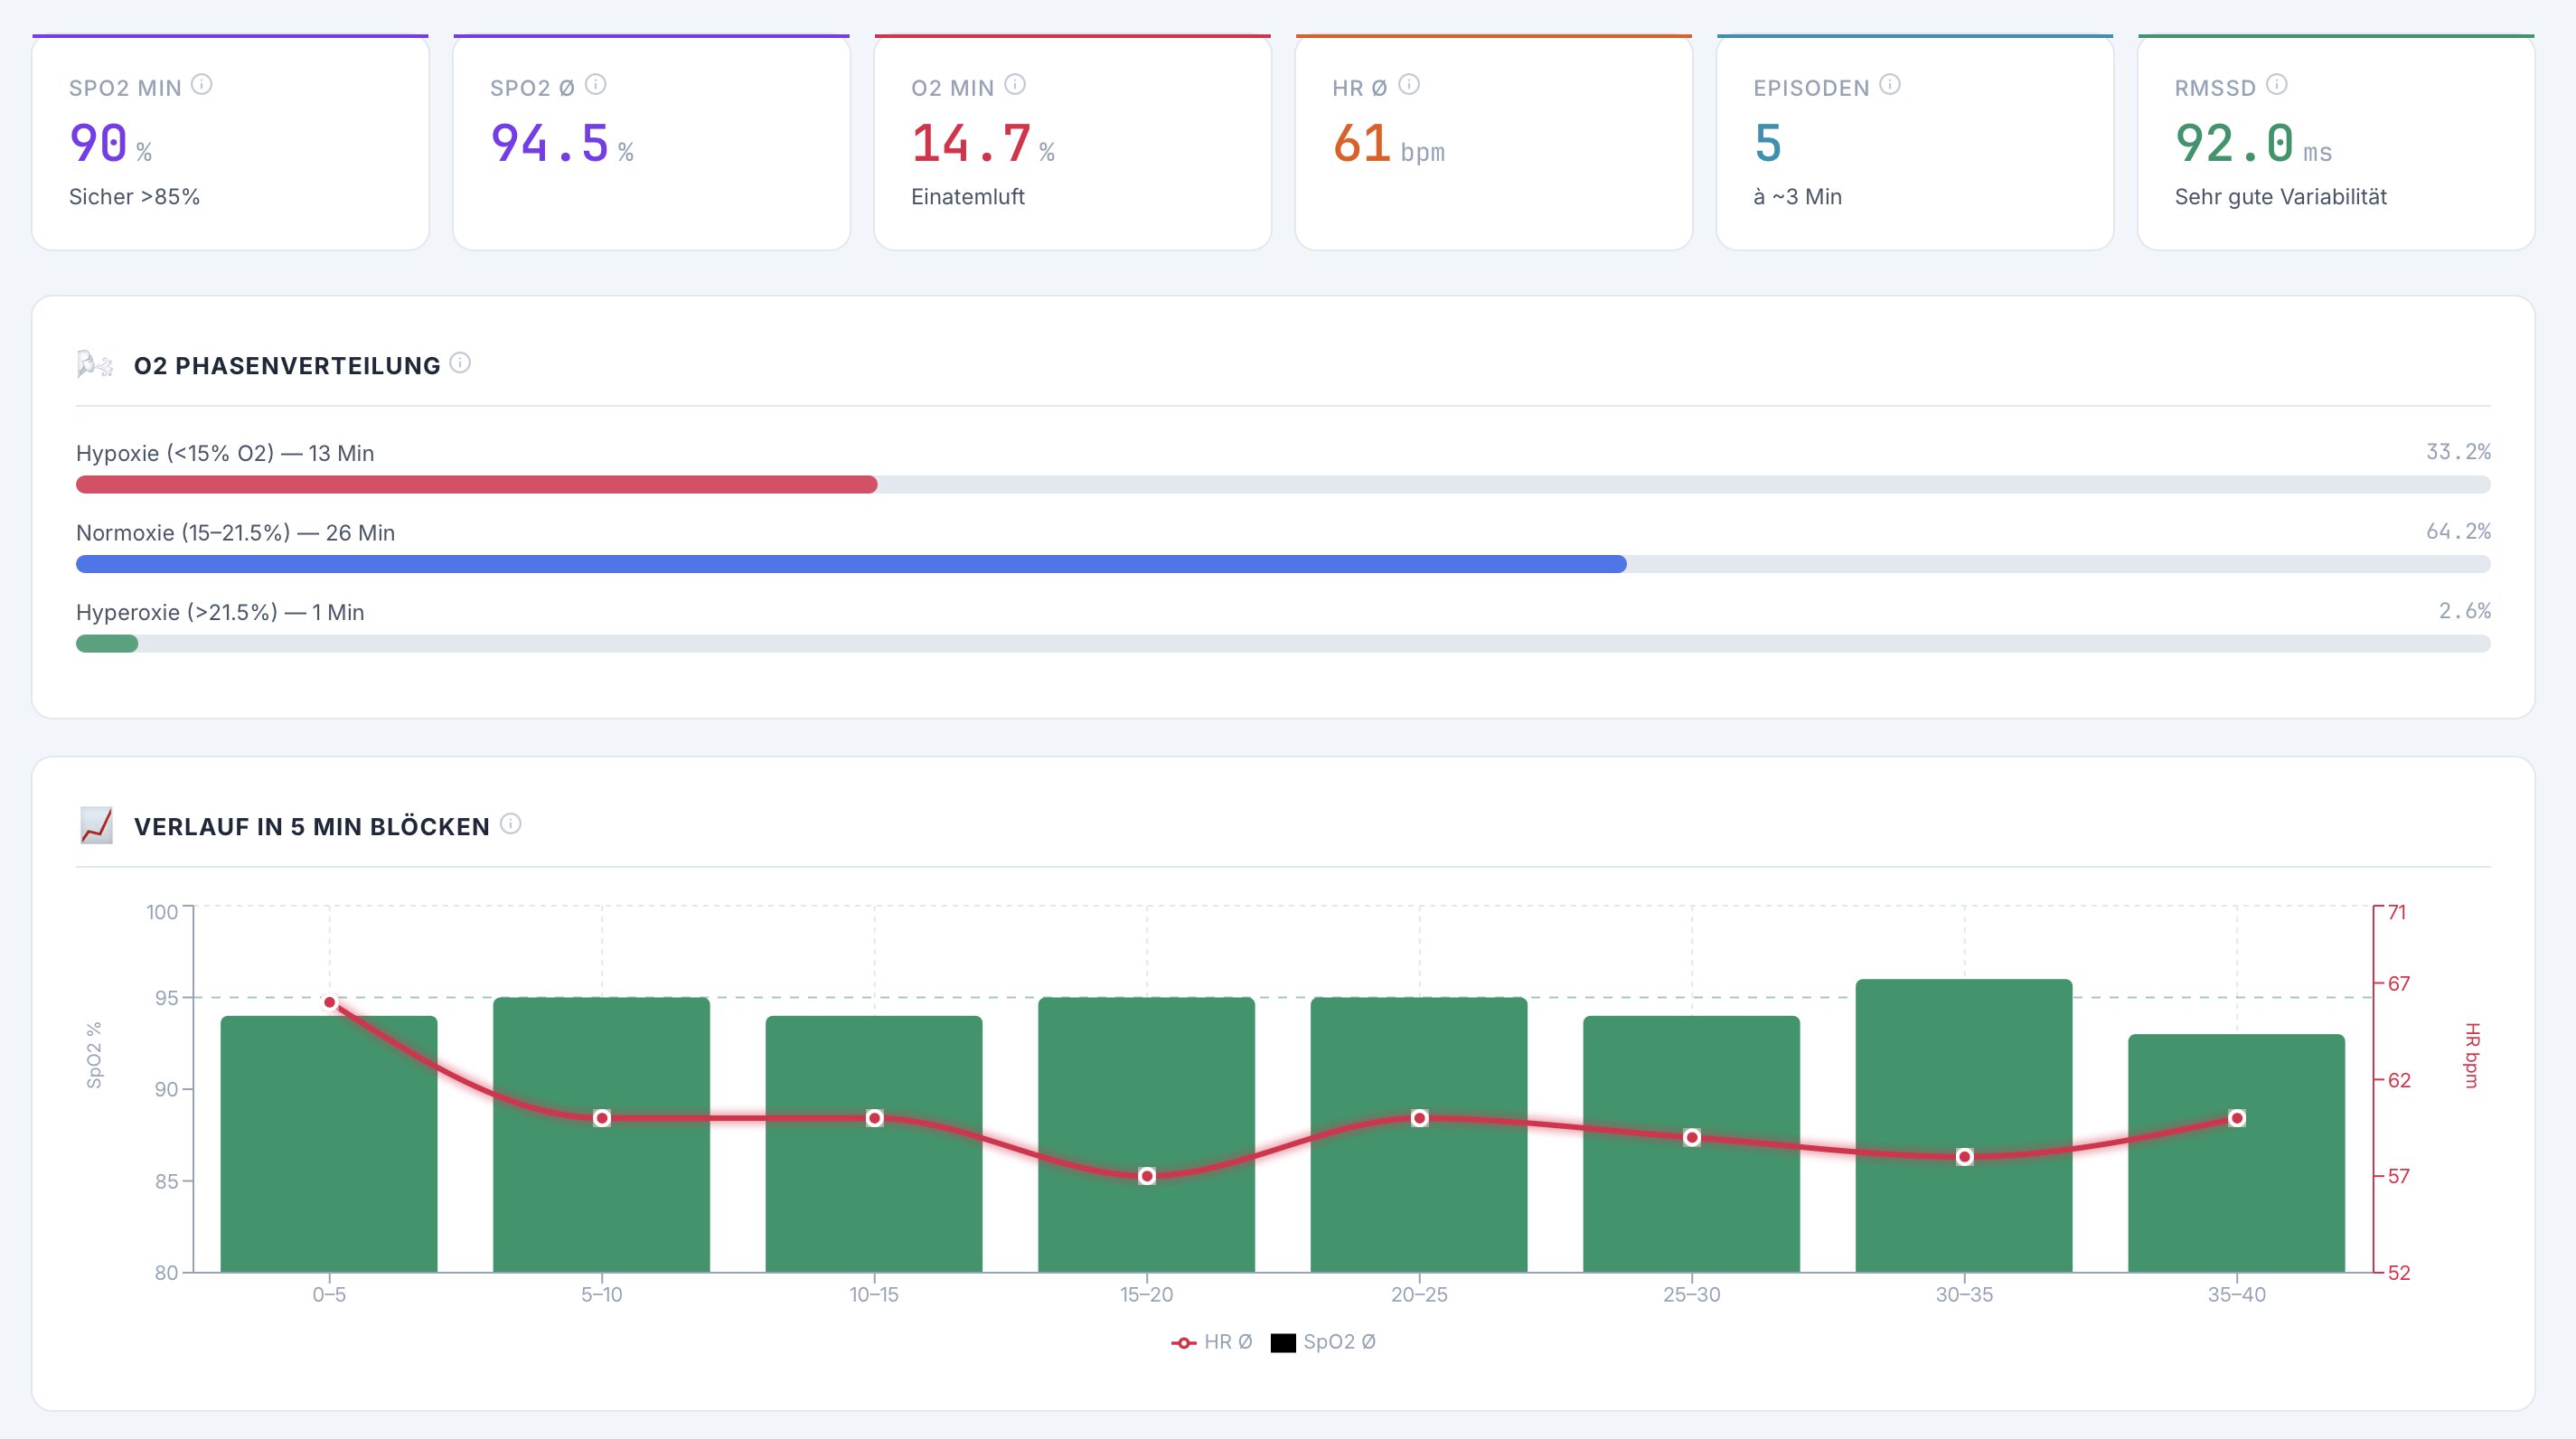
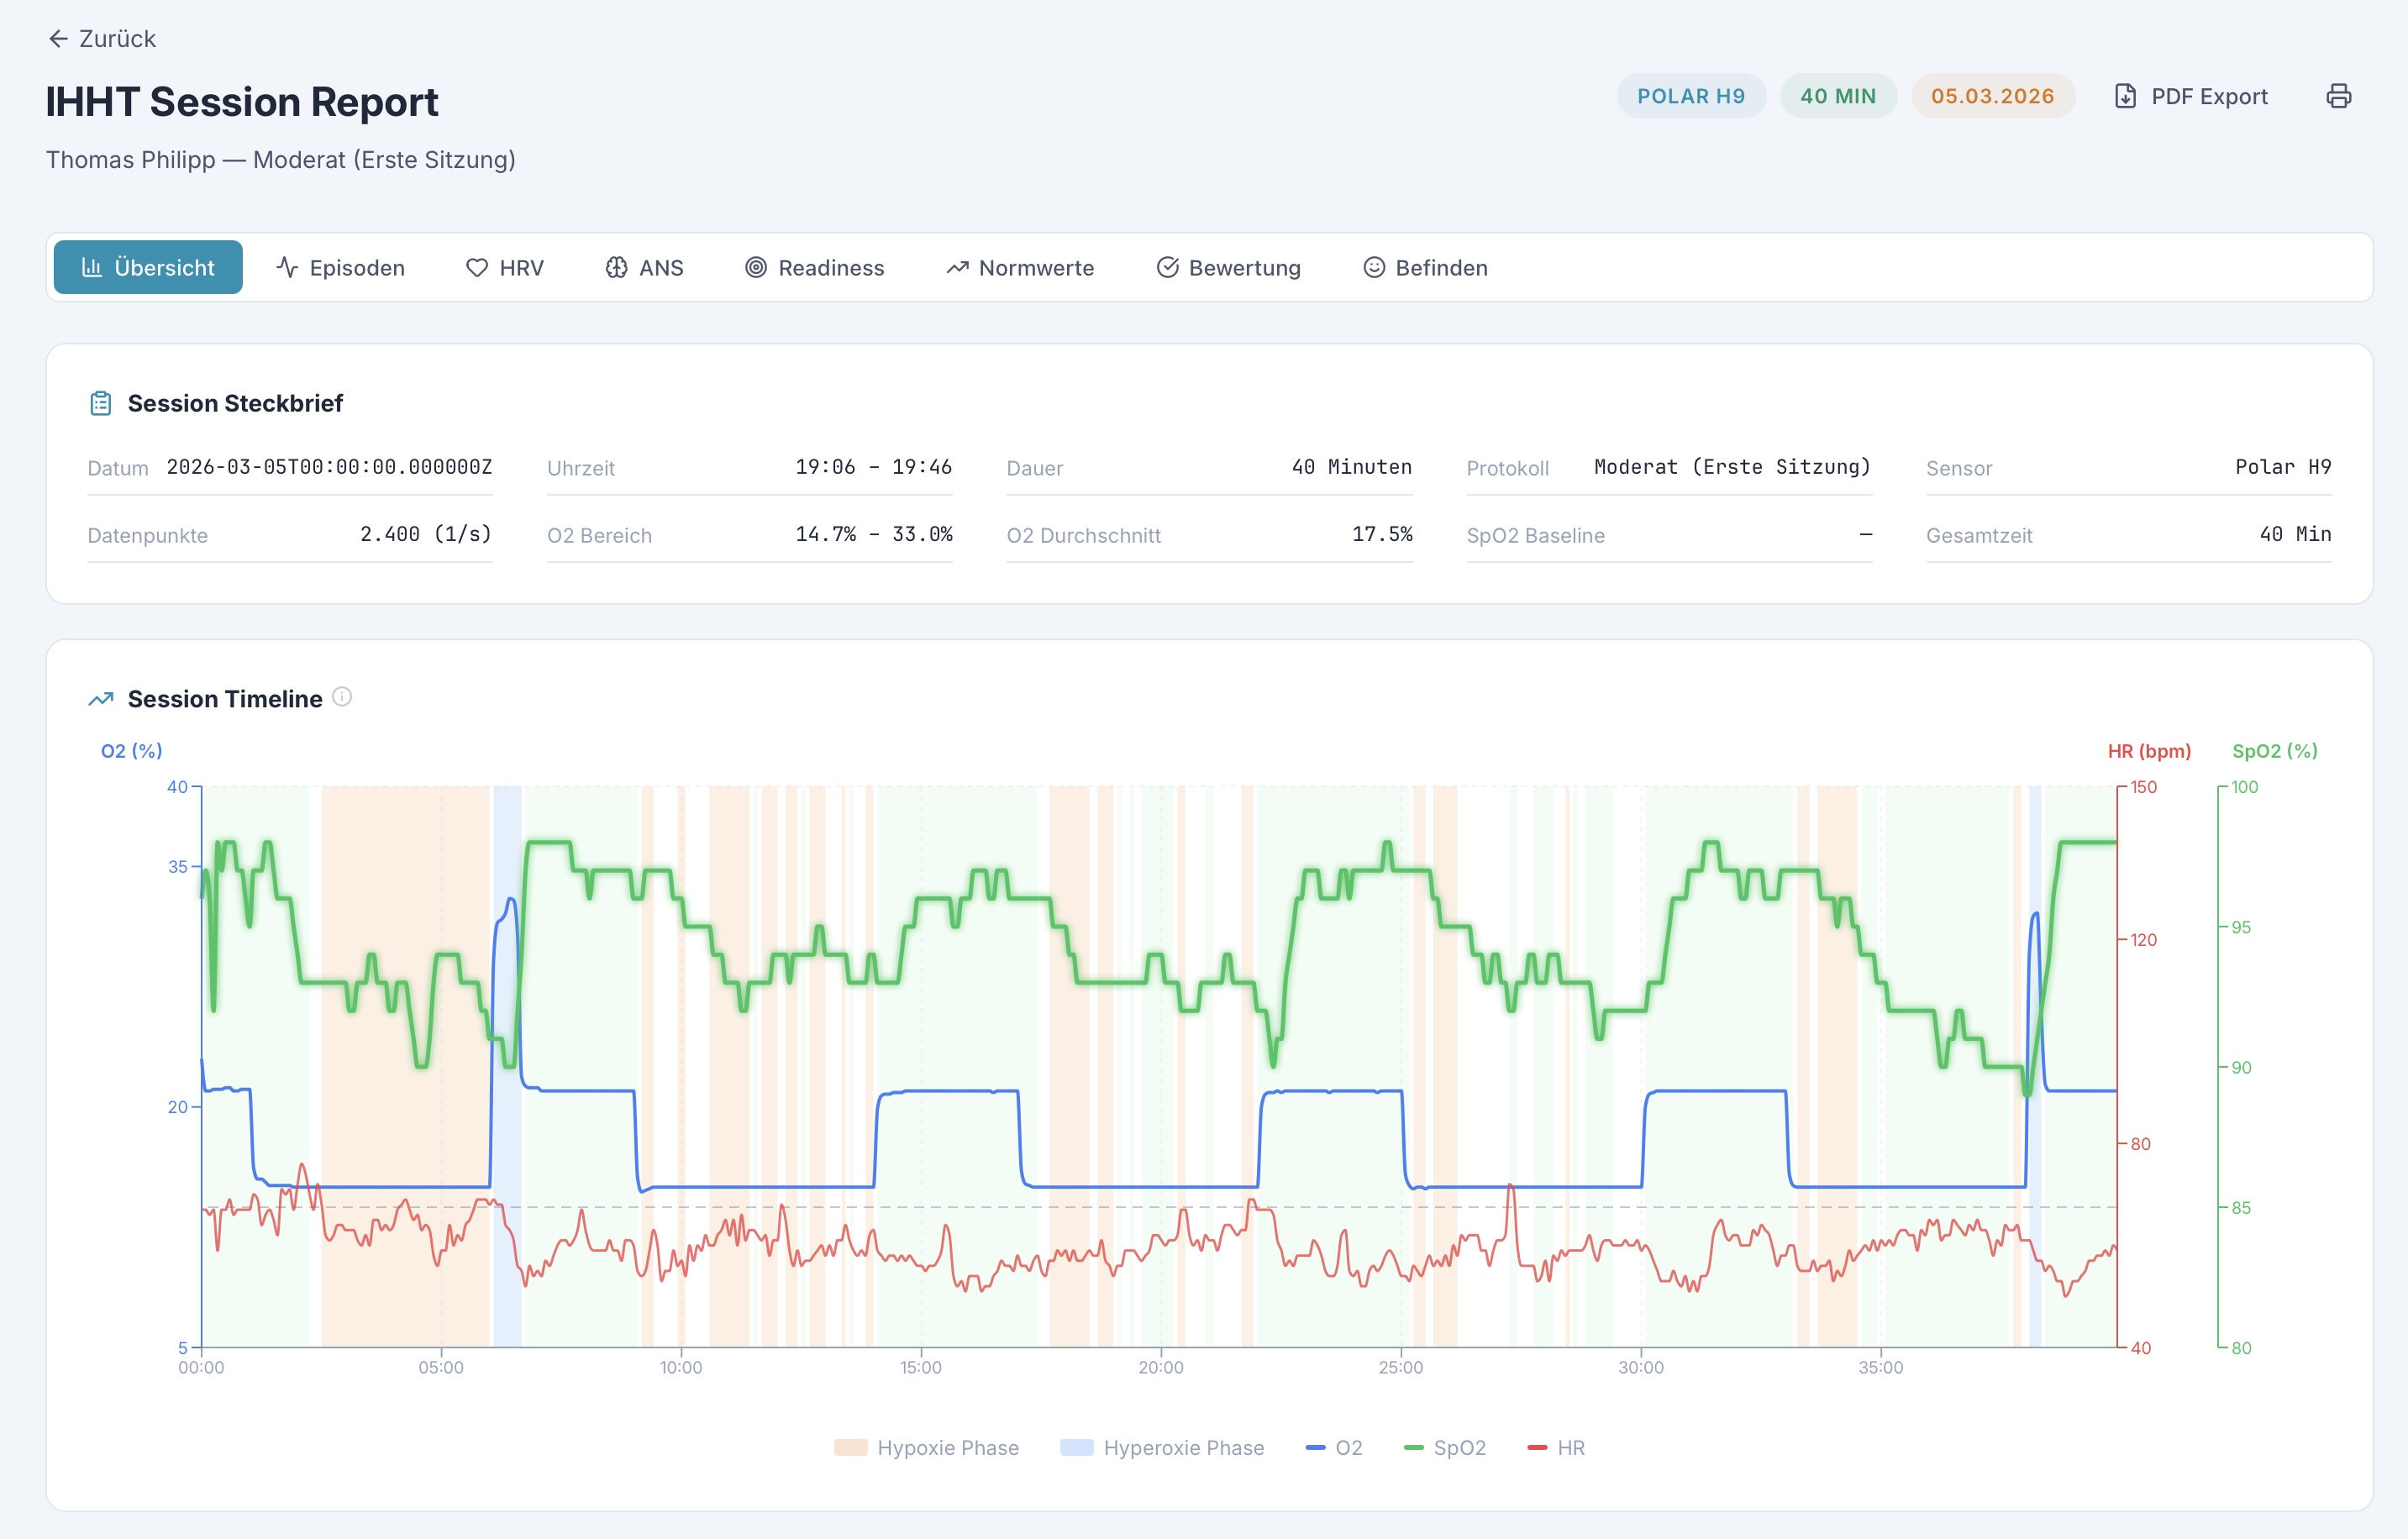
Respiriva automatically identifies hypoxia and hyperoxia episodes within each session. The algorithm detects phase transitions, calculates individual episode durations, and provides comprehensive distribution statistics.
This analysis is critical for evaluating training effectiveness. How deep did the desaturation go? How quickly did the client recover? How consistent were the cycles? Respiriva answers all of these questions automatically.
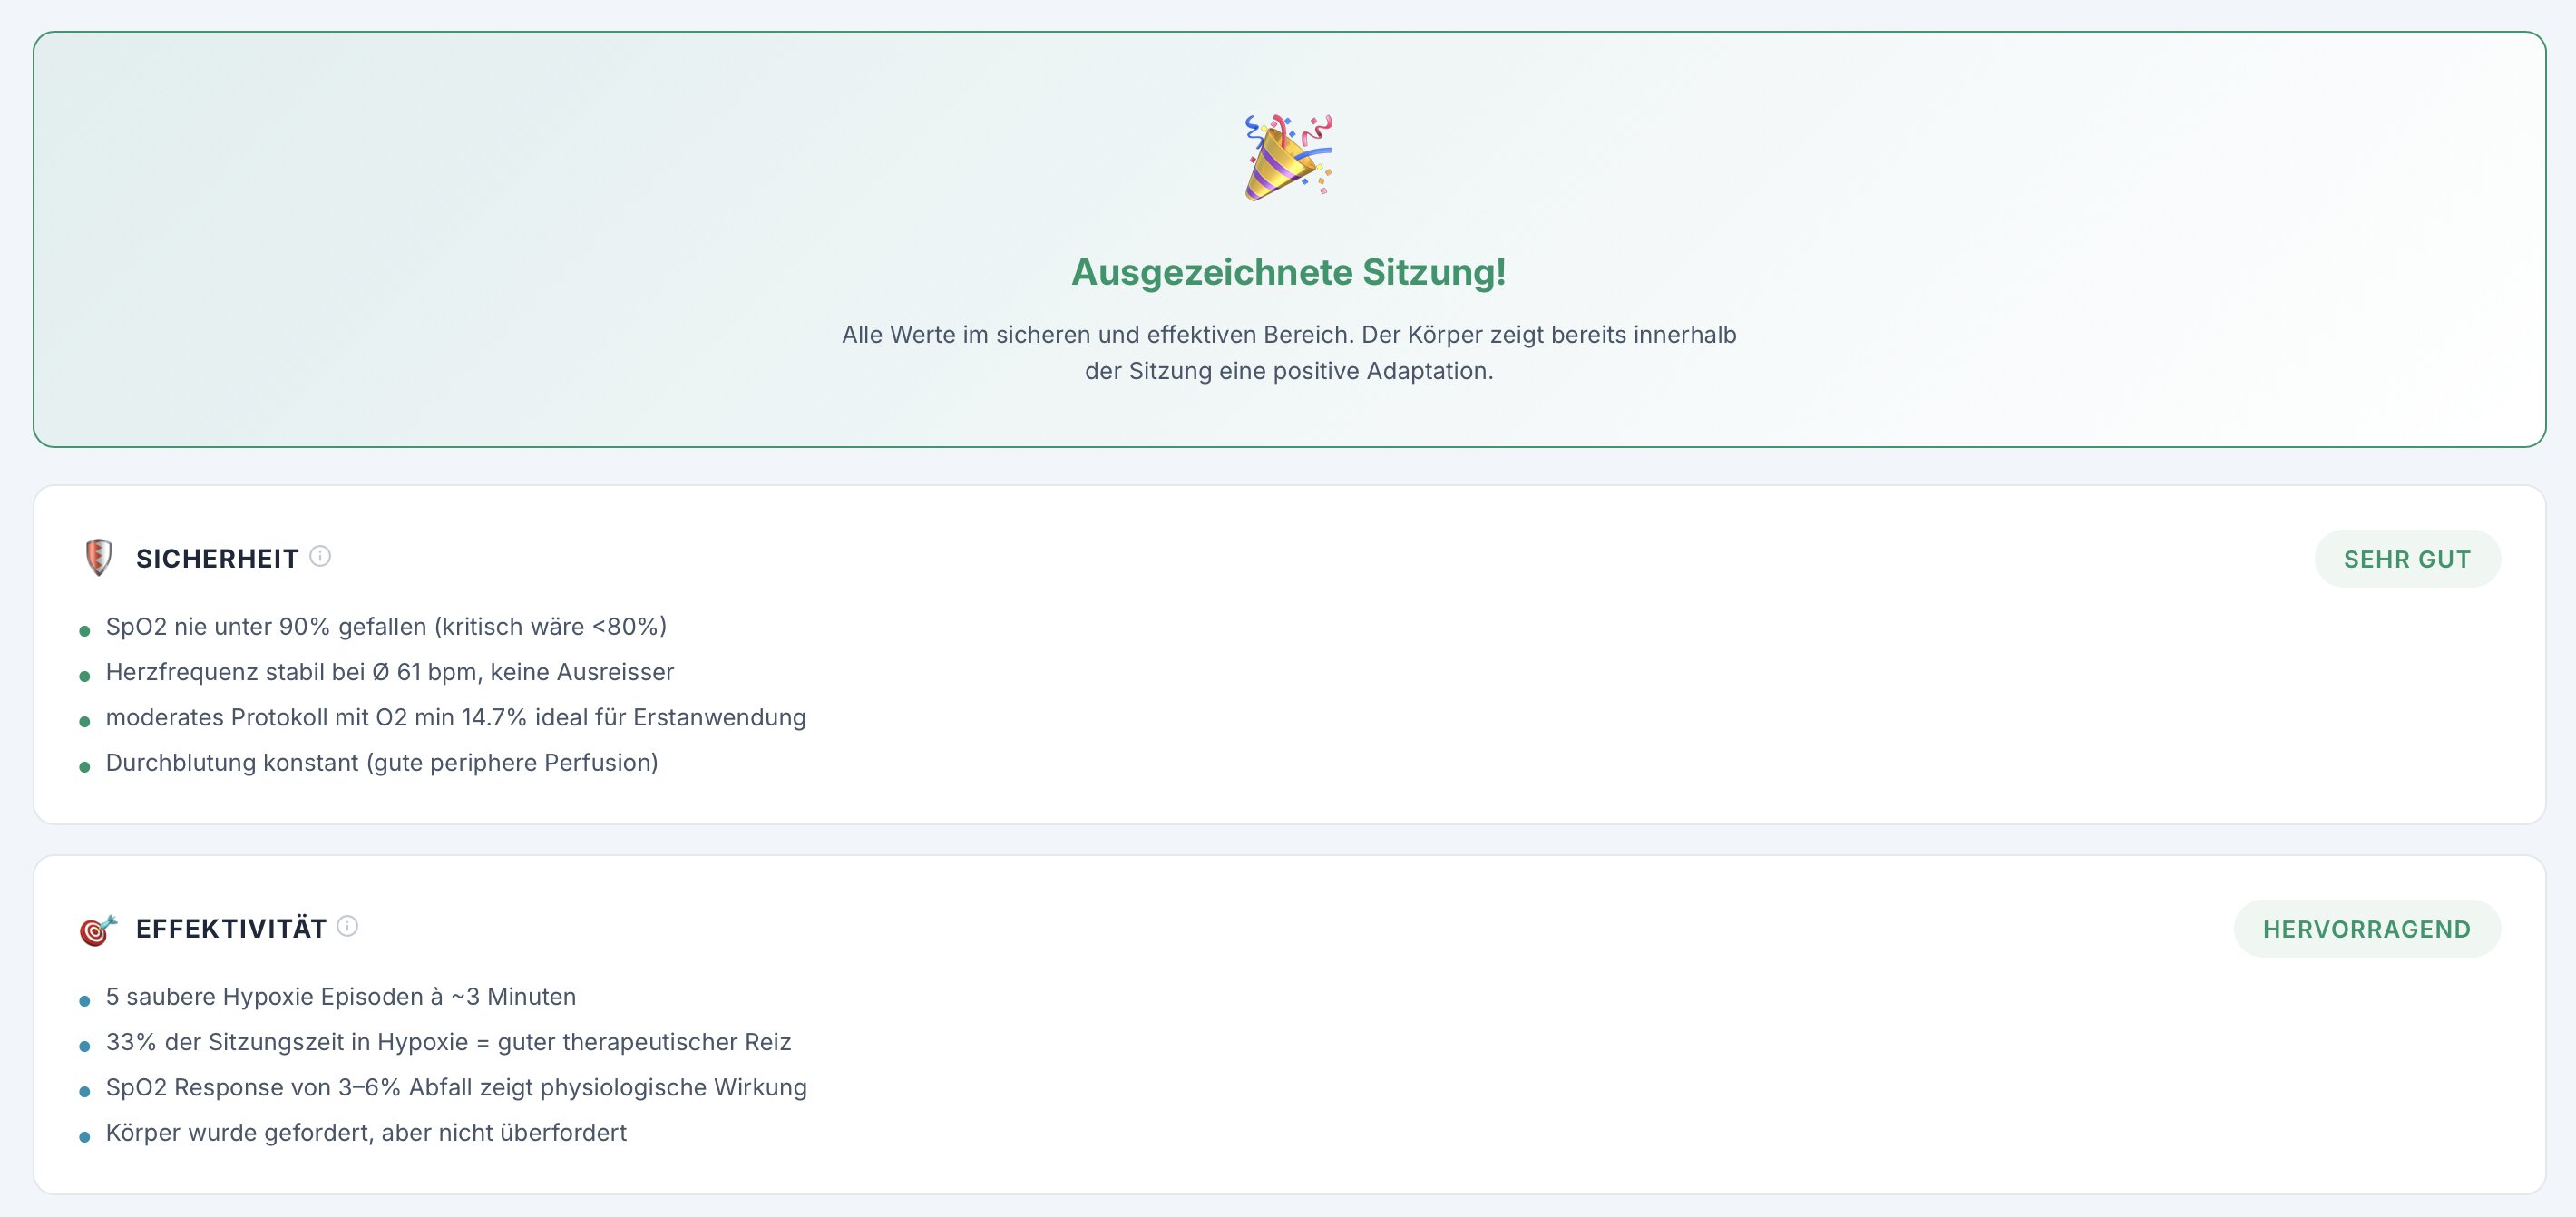
All analysis results are fed into AI models (Claude, GPT, or Gemini) that generate comprehensive, human-readable session assessments. The AI considers the full client history, previous sessions, and current metrics to provide personalized, context-aware interpretations.
The result is not just numbers, but actionable insights: What went well? What could be improved? How does this session compare to previous ones? What should the next session look like?
Request a demo and explore how Respiriva's analysis engine can elevate your IHHT practice with scientific depth and AI intelligence.
Request a Demo